How data teams can continuously grow business impact with Metric Trees

At Hashboard, we believe data can be the most important driver of growth for your business. We’ve seen that continuous improvement practices like weekly business reviews (WBR) can have a tremendous impact on a business’s ability to continually grow. We’ve already built a centralized Metrics catalog to provide a hub for everyone to track Metrics progress and support practices like WBR. We’ve now added the ability to define Metric Trees to give everyone the ability to quickly diagnose metric performance and effects on top-level goals.
You’ll find native support for Metric Trees on our Metrics page because we believe that metric trees should live side by side with your metric data, rather than in a separate document. This allows everyone to iterate, hypothesize, and test in one place — making it easier to get to the root of what’s driving growth.
What are Metric Trees?

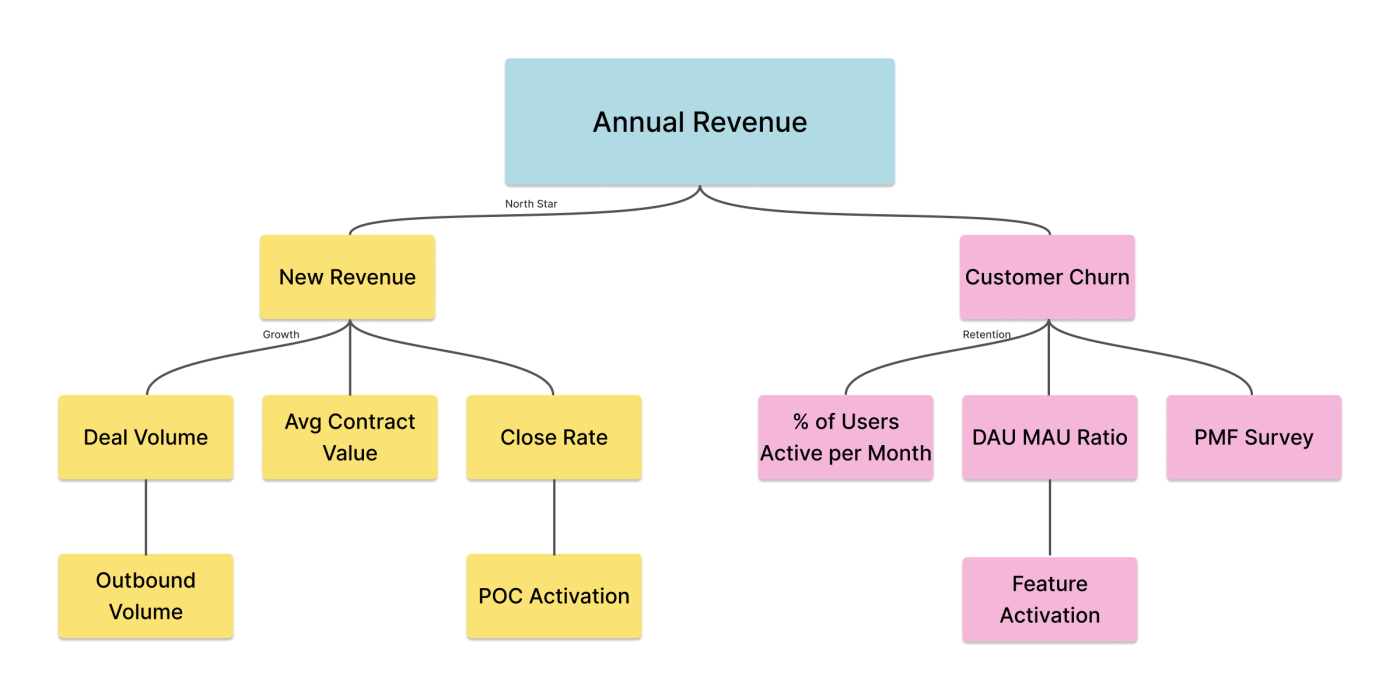
Metric Trees are a tool to build a model of your business using hierarchical metrics. They provide an instrumented map of business performance starting with North Star metrics and drill down to controllable input metrics. North Star metrics are the top level metric that the entire company is aiming to drive. A Metric Tree enables your stakeholders to diagnose and attribute variations in metric performance with the ultimate goal of driving the North Star metric.
Metric Trees attribute your North Star metrics to inputs and outputs
In any BI tool, numerous metrics are tracked across various dashboards and charts. Understanding the relationships between these metrics is crucial. Everyone in your company should be able to answer questions like:
Which metrics are most important to the business?
How do individual team or function metrics contribute to company-wide goals?
Data teams frequently attempt to structure these relationships by designing hierarchies with a dashboard, creating links between dashboards, and building indexes in external documents. However, these structures are difficult to maintain (broken links) and often fail to deliver a cohesive snapshot of overall business performance (ambiguous layouts).
Metric Trees provide a visual framework for understanding how metrics drive North Star metrics. Viewers can start at the top of the tree (the North Star metric) and work their way down in order to attribute performance to deeper level metrics. Similarly, a contributor on an input metric can follow the tree upward to understand how their work ultimately drives the North Star metric.
Building connections by branching out
Creating a Metric Tree requires working closely with your business leaders and stakeholders to map their understanding of what drives core business metrics to calculated metrics. This is an excellent opportunity to discover what is important to the various functions within your business and build relationships throughout the organization.
To actually decide what goes into the tree, the most important first step is to establish North Star metrics, which are the top-level metrics that the success of your business is ultimately evaluated on. From there, work with whoever is responsible for the North Star performance to understand what the driver metrics might be. Collaborating with key stakeholders, you’ll work down each branch of the tree, using your knowledge about the business to decide what and how to measure.
It can be worth finding a sponsor on the leadership team to help out with this exercise. We’ve seen that the CFO is often interested in sponsoring the build with the goal of using Metric Trees to implement practices like weekly business reviews (WBR). In many cases, they’ll already have a map of the North Star metric and the main drivers growing in their mind.
Your personal experience mapping out the Metric Tree will vary based on the existing people, process, and culture of your organization. In any case, the core of the work will involve getting out there and talking to your business stakeholders.
Metric Trees are a hypothesis testing platform
At the end of this exercise, you will start with the initial version of the Metric Tree. Your goal should be to evolve the Metric Tree over time. You should be learning through a closed loop, such as a business review process, about what driver metrics actually can move the needle on their output metrics.
This closed loop is the core concept of Continuous Improvement. Each metric owner should be continually forming and testing hypotheses about how to drive metric performance. Overtime, this will introduce new potential driver metrics and prune ineffective metrics as well. On top of that, strategic changes within your company might also shift the top-level metrics.
Hashboard makes building and reading Metric Trees easy
Hashboard already has a Metrics page, a central place to define business metrics with statuses and owners. Now, we’re adding the ability to define which metrics drive another metric. All together, these relationships are visualized as a folding tree structure. Now, you can inspect the performance of all your business metrics on a single pane of glass while also drilling into driver metrics.
As your Metric Tree evolves over time, Hashboard’s code-based version control system makes it easy to understand what changes have occurred and who made them.